Monday, May 31, 2010

Wk21: Market Recap


“Sell in May and go away” holds true for investors once more as heavy selling continued last week, the biggest monthly loss since February of 2009. Volume was well above average on this past months selling and with all the news overseas, investors are shaken.

Why do we care about the “investors” if we are short term traders? Investors are the ones that move the market on a month to month basis, while certain day trading and high frequency firms have the power to move the markets intraday, the longer term trend is established by the longer timeframe investor.

As short term traders, the first thing we want to do when starting a new day, week, or month, is to identify what trend we are currently in on the longer timeframes and work our way down to the timeframe in which we trade.

Wk22: Market Forecast

In the week ahead look for these news announcements to act as potential market movers

This week is sure to shed some light on the next longer term move. If we continue to sell off, massive panic could ensue, however I do not believe this will be the case. It would make sense that we see 1125 on the S&P, at least before we see 1040 again. This would be a great opportunity to add some swing shorts and take profits on longs. Below are the pivot levels for the week and month.


Our line in the sand for the week will be $1122 bullish above, bearish below, meaning if we break above this level, we will look to double top on the S&P, if we come up to 1122 and fall back down we will look to a target of $1005 on the S&P, yikes.


Wk22: Watchlist

These are some of the stocks we’re long and short going into this week. We will follow up in the week with some additional names to establish new positions in.

Bullish: AKAM, CIT, DTV, DNDN, NEM, SNDK
Bearish: DIA, GRMN, PBR

Thursday, May 27, 2010

Daily Reflection: 05.27

Let's not load the boat long just yet. Grabbing a few shorts as we inch higher is a smart play as we continue to see lighter volume on the rallies. Tomorrow we should see some decent trading in the morning then a very slow afternoon session as trader's head out early for a 3-day weekend.

Tuesday, May 25, 2010

Wk21: Watchlist

Longs: ABX, GG, NEM (Same sector), AKAM, DTV, CMG, DAL, SNDK, NFLX, VCI

Shorts: GRMN, LEN

Daily Reflection: 05.25


Have we hit a bottom? Today’s price action sure seems like it. We opened the day at -140:1 breadth and closed at 1:1 grinding higher all day. The market is heavily extended to the downside and has held support at the 2010 lows. When we see a daily hammer candle pattern (on the SPX) as large we’ve seen today, it is common for us to gap higher the following day. If this does occur, we will be looking to add to long positions and enter new positions at a pullback to tomorrow’s gap fill of 1073 on the ES.

Monday, May 24, 2010

Daily Reflection: 05.24

With a VIX near the 40s, we are expecting a lot of volatility this week. A lot of news announcements can act as catalysts, not to mention the situation with the EU. We remain delta neutral.

Sunday, May 23, 2010

Wk21: Market Forecast

Many good nuggets of information can be found in this weeks daily reflection posts. This week we are expecting some sort of bounce. News announcements can be found here and include GDP on Thursday. Volatility remains high so be prepared form continued large intraday swings. We are expecting volatility to remain high through the summer. Volume remains higher on the down weeks and lighter on the up weeks.

Thursday, May 20, 2010

Daily Reflection: 05.20

First the scare, then the tear. Last Thursday’s price action was essentially mimicked today only with less violence. Below is an excel spreadsheet I use to record the market internals. The important columns to note are the Trin and the NYSE % change. The light orange dot represents a bearish Trin close on the day, the following day we had a bullish Trin close, but a bearish market. This is an extreme warning signal. When we see Trin readings above 2.0 and fail to rally the next day we are headed for an extreme slide which happened the following day (see red dot).


Where to go from here? We continue to stress the important of remaining delta neutral or at least hedged if you are delta long. We will be looking to add shorts/puts on any bounce.

Wednesday, May 19, 2010

Daily Reflection: 05.19

A choppy day today, but again nice size intraday swings on the /ES. The 6E was a nightmare to trade and we will be treadding lightly for the remainder of the week. We have three scenarios for tomorrow.

1. If we move up to $1123 and and sell off, we will have a downside target of $1088.

2. If we move up to $1123 and continue up through $1129 will have a bullish target of $1203.

3. If we open and do NOT trade up to $1123, but sell off from the open breaking our 1098.75 lows, then we will trade back down at $1056.

Tuesday, May 18, 2010

Daily Reflection: 05.18

Right from the open signs pointed to a gap fill, let me explain. Local pit traders (those trading their own capital) vs. brokers (those trading client capital) tend to fade the opening gap on the open of each morning. This means if we gap up, they are looking to sell, and if we gap down they are looking to buy. Knowing we never want to fight the gap fill (going long on a gap up, or short on a gap down). However some days we call gap and go days, that is, we gap up and move higher all day. We need three things for a gap and go day to happen, a gap (obviously) strong breath in the direction of the gap, and $BANK trading in the direction of the gap. We also look to the ticks for additional confirmation.

So now let’s rewind to this morning. We had a gap up, strong breadth of 7:1, however immediately after the opening bell, the $BANK index began to fill its gap. From here we look to the core sector list where we saw the SOX, XBD, and BKX all trading in the bottom of the list, as well as XLF in the bottom of the SPDR Sector list. This weakness in these core sectors led the markets lower and they remained weak all day.

Monday, May 17, 2010

Daily Reflection: 05.17


Gold stocks failed to break the highs of Friday, as the market sold off and then rallied into the close. What does this mean? We’re more bullish on stocks, and should see a decline in the VIX. When everyone expects the markets to go down, they go up.

Sunday, May 16, 2010

Wk20: Market Forecast

The Dow Jones and the S&P 500 started off the week with impressive gains, making up for just about the whole slide from the previous week. The Dow finished the week up 2.3%, although, it spent Thursday and Friday selling off.

We are looking at the 10,400 level in the Dow and the 1120 level in the S&P which are their 50% retracements for bulls. As a case for the bears, the Euro currency has hit an 18 month low as a reaction to the European Union’s $1 trillion emergency package. If we see the Euro continue to slide, we are likely to see it weigh on equities and cause increased volatility in the coming weeks.

With gold stocks performing relatively well, we are seeing a “gold to stocks ratio” at only 1.1, this almost perfect correlation is a rarity, occurring only a few times dating back to 1928. As gold is a safe haven for investors in case of lower equities, we could possibly see a change in this correlation, I.e. (higher gold prices, lower equity prices).

With the Euro at 18 month lows and concerns overseas, we are likely to see continued volatility, which should be a very profitable environment for traders. Don’t forget we have options expiry this Friday, happy trading everyone!

Friday, May 14, 2010

Wk20: Watchlist

News announcements for the week ahead can be found here. These are the stocks we are watching for next week 5/16/2010...

Longs: ABX, AUY, CELG, EMC, GG, NEM, SLV, SLW, UNH

Shorts: FXE, GS, LVS, WLP

Given that next week is Options Expiry we will be looking to buy June Calls/Puts on these names. We would like to balance the delta on the portfolio and we are looking at ITM options with approx 70% intrinsic value. Here is a demo of the TOS options tab that describes how to go about this.

Thursday, May 13, 2010

Daily Reflection: 05.13

A very choppy day that provided many intraday setups. To continue our discussion on positioning and trade entry, I would like to stress the importance of NOT chasing moves.

We do this by identifying our entry, stop, and profit target before the trade is even placed. One of the hardest things for a trader to do, which may surprise you, is let his profits run.

A trader is quick to let a stop get hit, but often when a small profit is had, the trader gets nervous and exits the position too early. This can be avoided by having a money management strategy that moves the stop to break even + commissions at say, +2PTS on the /ES, or after a 1 or 2% move in a particular stock. Then you are able to “walk away” from the trade leaving your stop and profit target in place, giving you a free trade if it doesn’t work out.

Wednesday, May 12, 2010

Daily Reflection: 05.12

Positioning yourself a move is obviously the first step to a profitable trade. When analyzing the market with whatever method you prefer, keep in mind that the market will move with the least number of participants as possible. Understanding crowd behavior is in general more important than understanding complex economic theories.

Tuesday, May 11, 2010

Daily Reflection: 05.11

The put call ratio remains above 1.0 (a bullish sign), but let’s not forget about last week’s market action just yet. Both the Euro and S&P were quite choppy today and the SPY, DIA, QQQQ, and IWM all closed in a bearish inverted hammer candle formation. We will want to see a break over today’s highs.

Monday, May 10, 2010

Thursday's Market Crash w/ Pit Audio

Daily Reflection: 05.10


The market has plenty of room to run at this point and both the bulls and bears can make a great case for which direction the move could be. While volatility does remain in the upper 20’s, we are sitting at a halfway point between prior highs and Thursday’s lows. This is a spot where we like to put on directional option positions. Oddly enough the DOW has been the strongest out of this latest downturn while the NASDAQ and Russell have just barely made it to their halfway back mark.

Strong stocks like CMG and MO have been dragged down by the market, while weak stocks like AMAG and MON continue to slide. Remaining as close to delta neutral with our option portfolio at this point in time is how we position ourselves for the greatest profit opportunity.

With May expiration only 11 days away and volatility inflated, July premiums may be the way to position you in these directional plays. For those who think a sharp reaction is to come this week, then May options will be an effective way to take advantage.

On a weekly basis of market volume so far throughout 2010 we have seen heavier volume on down days versus up days and today is no different. While we did show stronger than average volume, it was considerably lower than the past two days. Most of last week’s volume is probably due to electronic sell programs and these programs will now be reset with the new price action that we’ve seen here. If we begin to move higher investors may see it as a sign to jump on board and this “chasing” will push prices higher.

Sunday, May 9, 2010

Wk19: Market Forecast

At this point Sunday evening 6:00PM CST the markets are up 19 S&P points and 150 Dow points. Where we open on Monday morning will be everything. We have been forming a large triangle pattern on the hourly chart and have two major price points on the S&P. If we open up around 1030, a large gap up, investors may see this as a great buying opportunity, however if we gap down and open around 1095, investors may see this as a sign to dump more securities sending the markets lower. News announcements for the week can be found here. Stay tuned for updates throughout the week.

Thursday, May 6, 2010

Daily Reflection: 05.06

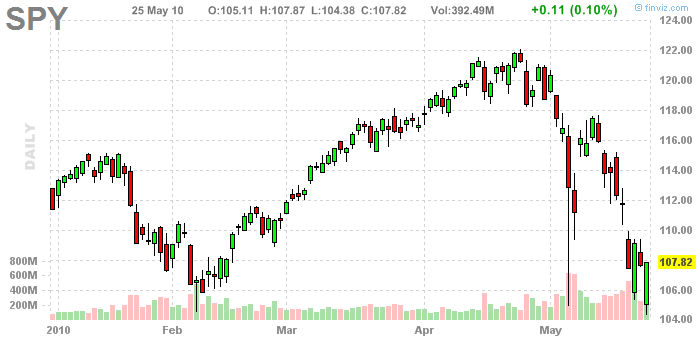
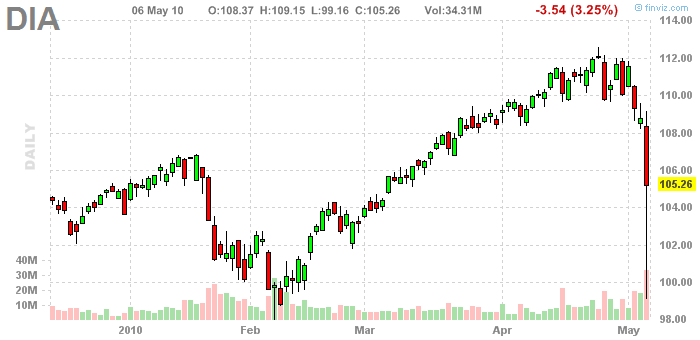
Lots to talk about today, at one point the /ES was moving 10 points in less than 10 seconds, enormous volume and volatility spiking into the 40s. Rather than spend your energy trying to find out the WHAT, let us focus on where to go from here, and what action can be taken to manage positions and how to execute new positions. The chart below says it all with the DOW spiking below 10,000 intraday, down nearly 1,000 points.


The markets are in a fragile state and while technology has advanced tremendously over the years, it simply speeds up the process of order execution. The inevitable is, well, inevitable. So what to do now? It's clear the global banking system is in trouble, ethics, and client interest have been compromised, but the markets don't care about any of this, it is simply an effect of collective human emotions.

Hindsight is 20/20, but what we have talked about in days past is the TRIN and the key levels, that being, a close above 2.0. On Wednesday the TRIN closed at 2.51, we then failed to rally the following day, which indicates the possibility of a severe decline. While these kinds of market reactions are impossible to predict, the TRIN did throw up a red flag.

Yesterday we talked about the Put/Call Ratio and a close of 1.15. This had a large part to do with the decline today. Huge amounts of stock had been acquired since the lows of March 2009 and investors and traders place stop orders all the way up. The cause of today’s market action is irrelevant, what is important to know is when millions of people are looking to sell at $50, and there are only 10 people looking to buy, they can essentially dictate their price, and say, throw out a bid of $10. With no one in-between these two prices, the price of the stock will drop dramatically.

Wednesday, May 5, 2010

Daily Reflection: 05.05

The market’s done it again, closing lower on stronger volume. The put call ratio closed the day above 1.0 therefore we are looking for a positive close on the day tomorrow. If you are trading futures and want a great alternative to TT or CQG you can check out Infinity Futures. Happy Cinco de Mayo!

Tuesday, May 4, 2010

Daily Reflection: 05.04


The markets tumble along with the Euro, volume jumps, the VIX spikes, and oil drops. We are looking for volatility to remain higher for “an extended period of time” and this increased volatility is making a great environment for intraday trading, but what to do from here?

The TRIN “Trader’s Index” aka. ARMS index, named after Richard Arms is an inverse relationship of market breadth, see this post for the calculation. When the TRIN closes ABOVE 2.0 the market has an 80% chance of rallying the next day. So how can we turn this into actionable information? If the market fails to rally in some way tomorrow we can expect an extended selloff. We have yet to make a 10% correction since the March 2009 lows, so we could be setting up here for a fantastic longer term buying/investing opportunity in the markets.

Monday, May 3, 2010

Daily Reflection: 05.03

Where we stand on the S&P, roughly halfway between the last swing high and swing low on the daily charts, we are at a great place for putting on positions. For those placing option positions this allows for calls and puts to be bought at a relatively neutral point because we can either breakout to new highs, or break lows and fall down to the next support level. Either way picking relatively strong and relatively weak companies to trade and placing your option positions on those companies gives you an edge.

Sunday, May 2, 2010

Wk18: Market Forecast

Racing mountain bikes this weekend left me tired and little time for posting. News announcements can be found here for the week which is heavily packed with them. We are watching for a close above 1210 on the S&P to get bullish and close below 1181 to get bearish.